
Forest plots
Confidence intervals, subgroups, pooled estimates and reference lines.
Build publication-ready figures in one editor that understands scientific data and still gives you precise control over layout, styling and export.
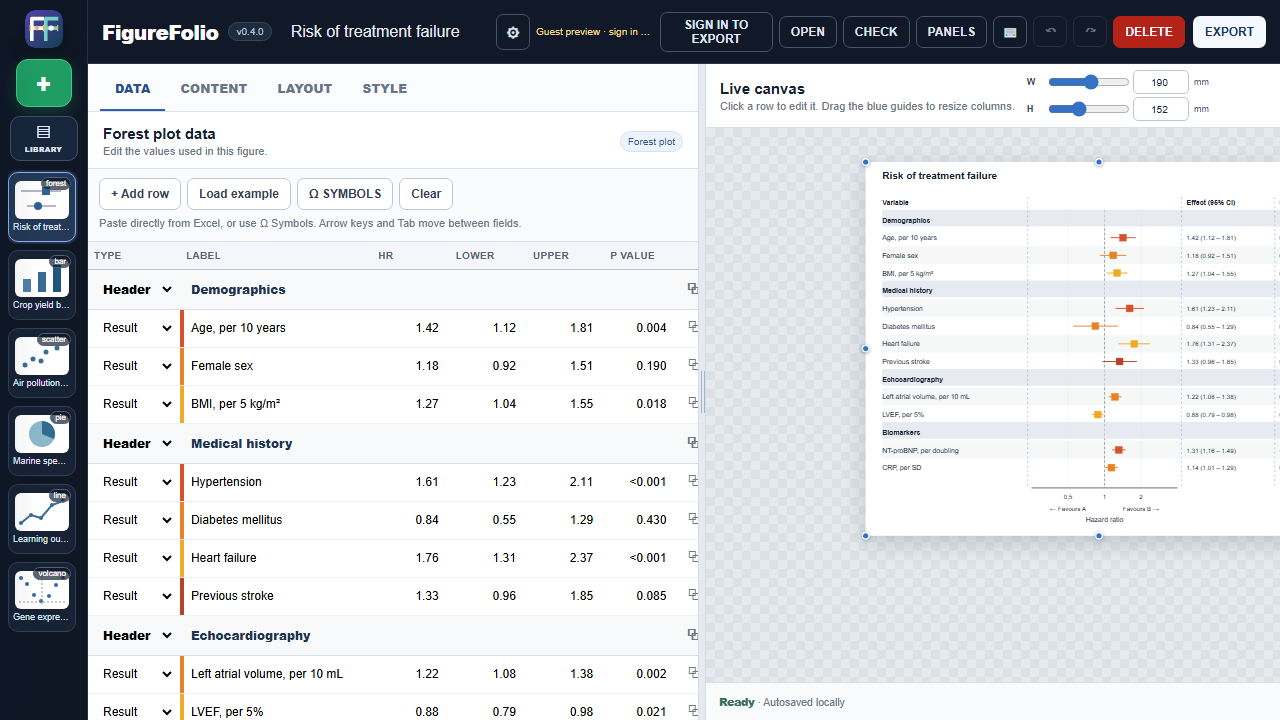
Set the scientific structure first, then refine layout and styling without leaving the live editor.
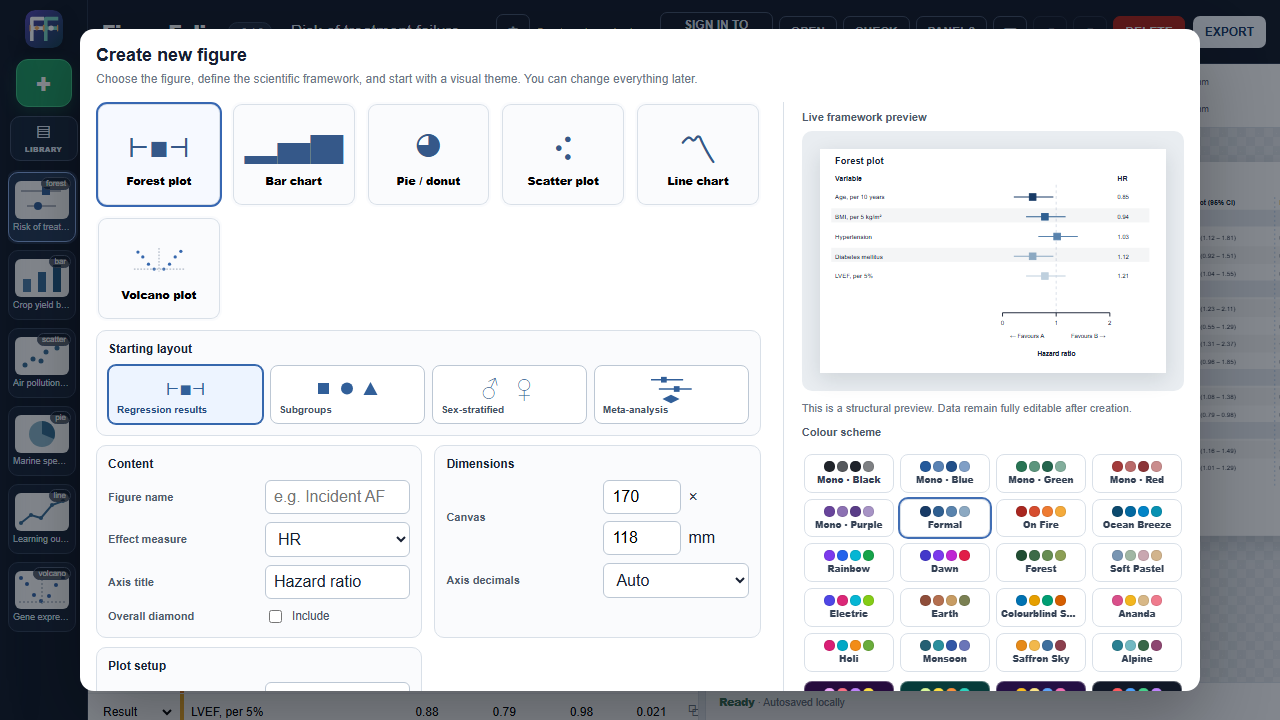
Begin with regression results, subgroups, sex-stratified results or meta-analysis. Set the scientific framework, dimensions and colour scheme in one place.
Keep global consistency, then fine-tune only the rows that need attention. Custom styles can be named, saved and reused across projects.
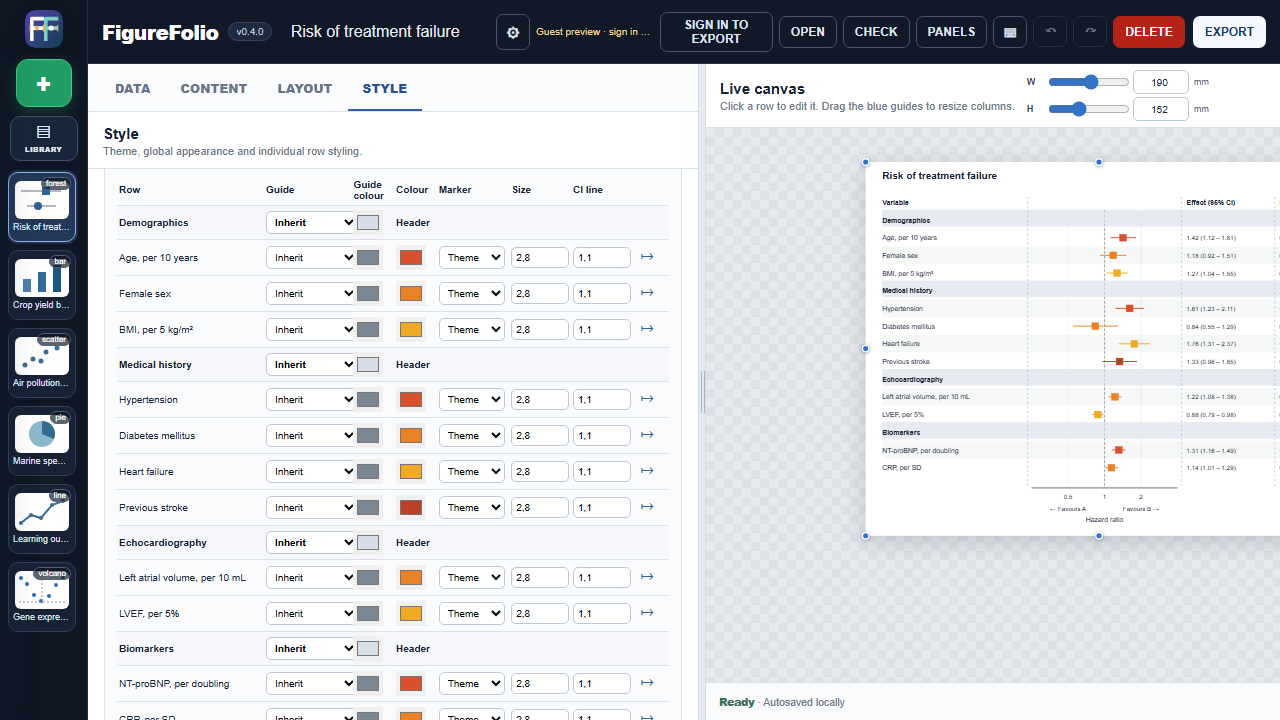
Build each figure with controls that match the science behind it.
Confidence intervals, subgroups, pooled estimates and reference lines.
Grouped bars, error bars, observations and significance annotations.
Clear proportions with flexible labels, legends and reusable styling.
Groups, regression lines, confidence bands and precise axes.
Longitudinal trends, repeated time points and uncertainty per series.
Effect size and statistical significance in one view.
Dot, box, violin and raincloud views for continuous data.
Before–after and repeated-measures data with subject-level links.
Survival curves, censoring and optional numbers-at-risk displays.
Sensitivity, specificity and AUC for diagnostic or prediction models.
Agreement between two measurement methods with limits of agreement.
Matrices and correlation structures with value-based colour mapping.
Frequency, density and cumulative distribution views.
Raw observations alongside effect estimates and uncertainty.
Meta-analysis effect estimates against study precision.
Concentration–response curves and multi-group comparisons.
Patient timelines, responses and status in clinical cohorts.
Ordered individual change for response and outcome displays.
Map X, Y and a third numerical dimension to bubble size.
Faceted panels for repeated comparisons on shared scales.
FigureFolio keeps the data, the scientific conventions and the visual result together.
Work directly with CIs, P values, weights, error bars, reference lines and scientific axis scales.
Resize the canvas, move legends and adjust the design while the live figure updates with you.
Save styles, reuse them across projects and combine figures into consistent multi-panel exports.
Explore the full designer immediately. Sign in when you want cloud storage and export.